We Offer You A Real Estate Insight & Research and Updates News in Global

Forecasting Economic Outcomes from the US Election

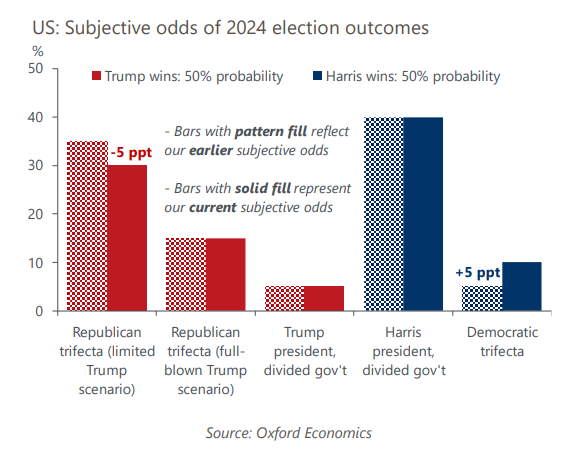
As the US election approaches, the potential economic outcomes are on everyone’s mind. Regardless of the result, the economy is poised for significant changes driven by the policy decisions of the next president and Congress. From tax cuts and spending adjustments to tariffs and trade relations, these changes will have far-reaching impacts.

Key Scenarios Explored:

  • Limited Trump Scenario (30%): Potential effects of extending Trump tax cuts, immigration restrictions, raising defence spending, and imposing targeted tariffs on imports from China and the EU.
  • Full-Blown Trump Scenario (15% odds): More aggressive tax cuts, substantial increases in spending, and blanket tariffs on imports from China and other trading partners.
  • Trump & Divided Government (5%): A mix of tax cuts and moderate spending changes and their economic implications.
  • Harris & Divided Government (40%): A bare-bones extension of the expiring Trump tax cuts, and restraint in federal discretionary spending.
  • Harris & Democratic Congress (10%): Estimated effects of federal investments in housing, childcare, and education and higher taxes on corporations and high earners.

Each of these scenarios offers a unique perspective on how the economy could evolve, affecting growth, inflation, and markets. To stay informed and ready for what’s ahead, download our detailed executive summary that delves into these possible futures shaped by the upcoming US election.

For more insights on the 2024 US Presidential Election

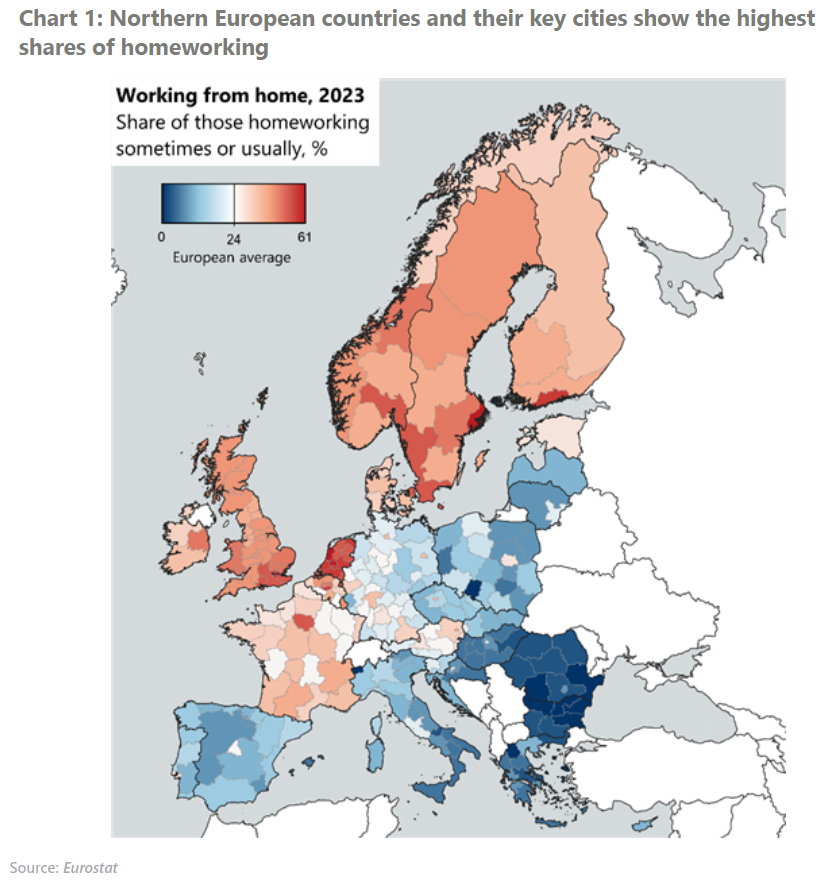
Working from home is most prevalent in northern European cities

Working from home looks to be entrenched in Europe. After peaking in 2021 during the COVID-19 pandemic and dropping slightly in 2022, the percentage of those working from home did not change in 2023. However, there is much variation both across and within European countries, with the UK, Netherlands, and the Nordics seeing the highest shares of homeworking. Hybrid working has already had a big impact on office markets, and combining homeworking trends with our forecasts for office-based employment can give insights into future office demand. What you will learn:

  • Among major cities, London, Stockholm, and Amsterdam reported the highest shares of residents working from home in 2023, with Paris not far behind in sixth place. At the other end of the spectrum, cities with sizeable manufacturing or hospitality sectors, such as Athens, Barcelona, and Milan, had lower shares of homeworking. There was also a reduced tendency to work from home in CEE cities, with Sofia and Bucharest at the bottom of our ranking of major cities.
  • Supplementing our analysis with high-frequency public transport use data, we find no significant pick-up in 2024 for London, Paris, nor Berlin. This points to homeworking prevailing in these cities this year, which is likely indicative of broader European trends.
  • Over the next five years, office demand in Madrid, Barcelona, and Bucharest will likely benefit from a combination of stronger forecast growth in office-based employment and lower shares of homeworking. Whereas below-average forecast growth for office-based employment in Amsterdam, Paris, and Brussels, combined with their high homeworking propensities, will likely result in more muted demand for office space.

Why is Indonesia moving its capital city?

The idea of moving Indonesia’s capital away from Jakarta has existed since the first days of Indonesia’s independence.

The primary driver for this move is the potentially irretrievable impact of land subsidence in Jakarta, caused by rapid urbanisation and excessive groundwater extraction. Jakarta is one of the fastest sinking cities in the world. Many commercial and residential areas, especially in the north of the city, have already been destroyed due to flooding which has also been exacerbated by climate change. Some areas are sinking by as much as 25cm per year and estimates suggest large swathes of the city could be fully submerged by 2050.

Other motivations for the relocation are related to spreading the distribution of wealth and activity more evenly throughout Indonesia, the economy of which has historically been centred on the island of Java.

However, the relocation plan has long been politically and logistically contentious. Plans for Nusantara, first announced by President Widodo in 2019, have been no exception, notably with regards to the impact of building a new city on an undeveloped area of ecological importance. The government’s funding strategy of relying on private investment to fund 80% of the construction costs has also been called into question.

Building a $35 billion new capital

According to the plan announced previously, building the new capital, Nusantara, will cost an estimated $35 billion and will not be finished until 2045.

This mega project is expected to boost the nation’s construction outlook significantly. We forecast the total construction work done in Indonesia will grow an average 8.5% p.a. over the four years to 2028. Activity is anticipated to ramp up over the forecast horizon, supported by a strong project pipeline, primarily from developments around the capital relocation. This major infrastructure project is a driver for increased fixed capital expenditure from both the private sector and foreign direct investment (FDI). This will stimulate construction activities across all segments:

A capital is born: The impact of Indonesia moving its capital city

  • Indonesia is planning to move its capital from Jakarta to Nusantara, as Jakarta faces the threat of sinking beneath the waves without urgent intervention.
  • This relocation will boost the country’s construction outlook, with the total construction work done in Indonesia expected to grow by an average 8.5% p.a. over the four years to 2028.
  • We do not expect the moves to establish Nusantara as the new capital to lead to a mass exodus from Jakarta.

Indonesia’s President Joko Widodo is expected to mark the country’s 79th anniversary of independence this month by hailing the official relocation of the country’s national capital away from Jakarta. The new capital will be a city named Nusantara, still under construction and located over 1,000km away from Jakarta in East Kalimantan province on Borneo Island. At an expected cost of construction of $35 billion and a population projected to reach nearly 2 million by 2045, the new capital city will be the new base of the country’s president and the government’s administration and ministries.

Chart: Indonesia’s new capital will be located over 1,000km away from the current capital Jakarta

Jakarta will not be replaced, neither its role, nor its problems

Jakarta is Indonesia’s economic capital and is the primary location for Indonesia’s high value services such as finance, business services, and information and communications (IT). Public administration represents around just 4% of economic output and employment in Jakarta. Although we would expect public administration activity to slow down or even shrink in Jakarta, we do not expect this to lead to a mass relocation of other activities. There may be some relocation of businesses and their workers that need to be in close proximity to the political establishment, but the majority will likely gain more from the agglomeration effects of being within the established commercial zones of the former capital.

Historical examples of capital moves to pre-planned cities, such as the relocation of Myanmar’s capital to Nay Pyi Taw from Yangon in 2006, also suggest that relocating the government administration does not normally lead to a substantially negative economic impact on the previous capital.

Hence, we would expect Jakarta to continue to develop as Indonesia’s economic and business centre of gravity despite the loss of central government representation.

Jakarta has been experiencing fast economic development through the expansion of its private services sectors and has the fastest growing IT sector among the major cities in Southeast Asia and indeed one of the fastest growing across Asia-Pacific more generally. Forecasts from our Asia Cities and Regional Forecasts Service show that in real terms by 2050, we expect its economy will be almost three times as large as it is today, while its population will peak at close to 11 million. Moreover, according to our own projections for Jakarta’s wider functional urban area, which includes Jakarta province and its satellite cities, the city is expected to have a population of more than 40 million by 2050, vastly dwarfing the projected population of the new capital.

However, Jakarta’s continued development does mean the capital relocation is unlikely to provide much reprieve from the environmental and infrastructure pressures it faces.

The national and provincial authorities are certainly aware of the issues and have pledged funds towards Jakarta’s urban regeneration, including improving public transportation and water management. Even the long gestating and often-shelved plans for constructing a giant sea wall have recently been revived.

Certainly, a major effort is required to arrest the city’s subsidence. If the situation becomes more acute, then a much greater displacement of people, businesses, and economic activity could become unavoidable.

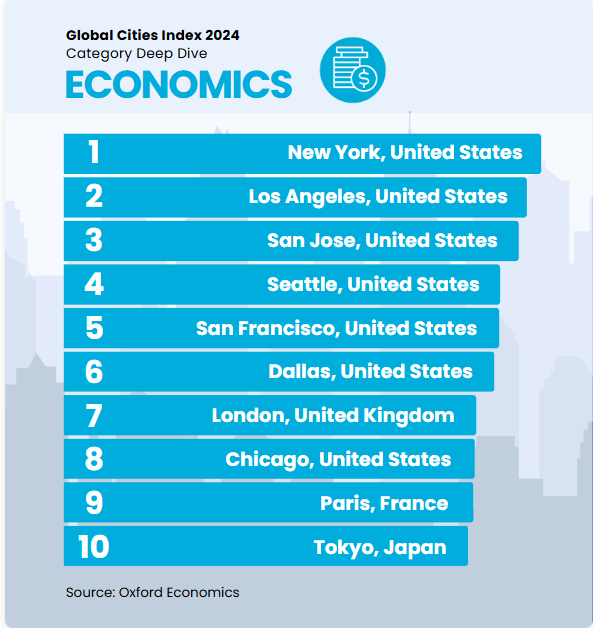
The top 10 cities in the Economics category

The cities topping the Economics category are the engines of the world economy. Seven of the top 10 are located in the United States, underscoring the country’s dominant economic role in the global marketplace. New York takes the top spot, as it has the largest city economy in the world by far: its GDP is nearly US$1 trillion larger than the next-biggest city economy (Tokyo). New York has also benefitted from stable economic growth in the decade preceding the Covid-19 outbreak. And although the city’s economy suffered more than many other American metros during the pandemic, it has rebounded strongly and its fortunes look positive for the future.

Hover over the chart to see the Economics scores of the top cities:

Next come the Californian metros of Los Angeles and San Jose. Like New York, Los Angeles has one of the largest city economies in the world and experienced stable growth in the decade prior to the Covid-19 outbreak. San Jose, on the other hand, has a smaller economy in aggregate terms, but the city has the highest levels of GDP per person in the world, significantly dwarfing all other cities in the index.

Rounding out the top five cities are Seattle and San Francisco. Like San Jose, these two cities are major tech hubs, which gives them top scores in both the GDP per person and aggregate GDP size metrics. Seattle slightly outshines its more southernly peer due to its more diverse and stable economy. The final two US metros in the top 10 are Dallas at #6 and Chicago at #8. They follow a similar formula to that of other American cities at the top of the rankings by having some of the largest economies in the world, coupled with stable growth.

The three non-US cities leading the rankings in the Economics category are behemoths of the global economy in their own right. London, Paris, and Tokyo are all among the five largest metro economies in the world, but they tend to trail their American counterparts in terms of GDP per person. London and Paris benefit from being the primary economic centres of their respective countries. And they both have strong scores for economic stability (which isn’t the case for many smaller cities in the UK and France), highlighting their consistent contributions to the global economy.

Despite having the second-largest metro economy in the world and the most diverse economy of any city in the top 10, Tokyo takes the 10th spot in the Economics category. The Japanese capital is held back from an even stronger performance in this category due its GDP growth forecast. Out of our 1,000 cities, we only expect 36 to experience slower GDP growth than Tokyo over the next five years. Slow growth prospects are nothing new to Tokyo, so it is a testament to the city’s resiliency that it still sits in our global top 10 for the Economics category, beating out many other major cities.

The Global Cities Index scores cities based on how they are performing today. But there are several global trends that have the potential to disrupt these rankings in years to come. An uneven economic outlook across regions, driven by lingering inflationary concerns, debt sustainability issues, and heightened interest rates, could result in a significant reshuffling of the top cities in the Economics category next year.


The top 10 cities in 2024 by economic power

A city’s economy plays an essential role in its prosperity and attractiveness to residents, businesses, and investors alike. As a fundamental aspect of urban development, economic vitality is key to a city’s wealth generation, employment opportunities, access to goods and services, and much more. But while GDP growth tends to be the single metric most often focused on, the rate at which a city’s economy is expanding is hardly the only (or in many cases, the most important) indicator by which to assess a city’s economy. So, in order to more comprehensively encapsulate the economic performance and potential of each of our 1,000 cities, we include six indicators in the Economics category

These indicators measure the economic size, structure, and growth of each city, examining both historical performance and future potential. They acknowledge the multifaceted manner in which a city’s economy shapes its urban landscape and drives investment.

The top 10 cities in the Human Capital category


The cities leading the Human Capital category are hubs for higher education and business innovation, helping them attract diverse and highly skilled populations. Cities in five regions appear in the top 10. London is the clear winner here, rising well above the rest of the pack. It has the most globally ranked universities of any city in the world and nearly the most global corporate headquarters as well. These educational and employment opportunities attract people from all over the world, helping to keep population growth above—and the age profile younger than—the rate of many peer cities, including New York, Tokyo, and Paris.


Hover over the chart to see the Human Capital scores of the top cities:

Tokyo takes the second spot in the Human Capital category, as it has the most corporate headquarters in the world and nearly as many universities as London. Despite worries about Japan’s ageing population making headlines in recent years, Tokyo remains a global hub for innovation, and its score in this category is further bolstered by very high levels of educational attainment.

In third place is Riyadh. The Saudi capital has become a leader in this category in part due to the country’s Vision 2030 program; several megaprojects in Riyadh have attracted foreign workers to the city, and many companies are relocating offices to its growing business hub. The story is similar in the other Middle Eastern city in the top 10, Abu Dhabi (#8). Like Riyadh, it has a young population with many foreign-born residents, and several corporate headquarters.

Despite being located on four different continents, New York, Seoul, Paris, and Sydney all follow the same path to the top of the rankings. All four are known for both their educational institutions and business districts. Some of the best universities in the world call these cities home, such as Columbia University, Seoul National University, Sorbonne University, and the University of Sydney. And they all act as hubs for business and innovation within their regions, but also play major roles on a global scale.

Washington, DC (#7) and Boston (#10) land in the top 10 in the Human Capital category because their residents are among the most highly educated in the world. In Washington, this is a byproduct of many people working in the city’s policymaking arenas, while in Boston, the educational ecosystem led by Harvard and MIT attracts talented students, academics, and researchers from around the globe.

The 2024 Human Capital rankings of the Global Cities Index highlight that there are leaders in this category across the world. No single region dominates the top 10, but a concurrence of global trends could reshape this list in the future. Diverging demographic outlooks, with slowing population growth in Asia and Europe, could elevate more North American and Middle Eastern cities. Meanwhile, the phenomenon of “deglobalisation” and other global migration patterns may alter where businesses and residents decide to put down roots. However, one thing remains clear: cities that continue to invest in their residents will outshine those that overlook them.

Human capital underpins the economic potential of every city

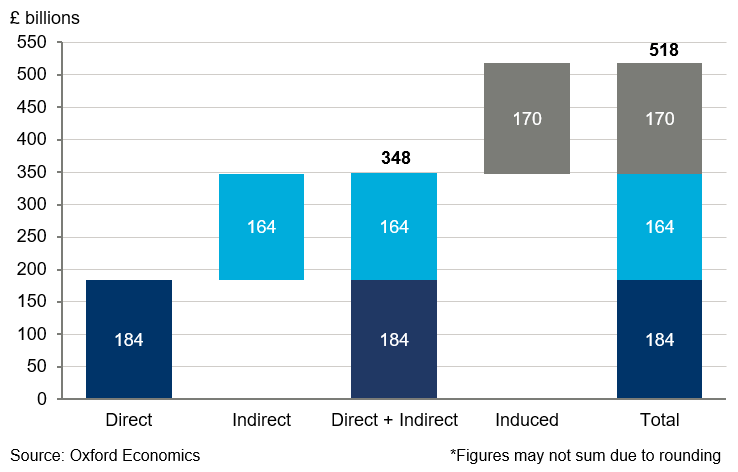
The pattern across these sectors is that currently there is a strong base that can be built upon to turn them into high growth areas. Our research into the manufacturing sector in the UK points to the wider benefits of investment in manufacturing beyond companies within the sector. While manufacturing firms contributed £184 billion to the UK economy in 2022, once their supply chains and employees’ spending are included that rises to half a trillion pounds (Fig 1).

Whether through more long-term policy planning, attracting investment, or increased infrastructure spending there are good opportunities for growth within manufacturing and industrial policy. The government should take note of the change of wind in industrial policy and direct investment to critical infrastructure to ensure the UK doesn’t muddle its way through to a period of stagnation. 

Fig. 1. Total GVA contribution to UK GDP by the manufacturing sector, 2022

The UK needs a strategic vision if it wants to arrest the stagnation that has plagued the economy — and targeted industrial policy may be a good place to start. There has been a shift in the global narrative around industrial policy and whether this derives from de-risking supply chains, helping the green transition, or getting a head start on sectors with large growth prospects.

It is imperative the UK identifies and engages in shaping these industries of the future. Our analysis of the 2024 Spring Budget and last year’s autumn statement, as well as the current state of the market in battery production, data centres, and life sciences, suggests more needs to be done.

Headwinds to growth

The Department for Business and Trade’s 2023 UK battery strategy committed £2 billion of new capital and R&D funding for zero emissions vehicles, batteries, and their supply chains between 2025 and 2030. This may sound like a large investment, but this figure refers to investment across the entire value chain rather than simply the construction of gigafactories for battery manufacturing. The current pipeline sees a capacity shortfall of 33% in EV battery requirements for 2030. Bearing in mind that a single gigafactory can cost multiple billions of pounds, the scale of investment needed becomes apparent.

Data centres have been an area of strength for the UK economy as London’s position as a global financial hub gives the sector a head start by providing a strong base of energy infrastructure. Google’s recent $1 billion investment in a new data centre in Hertfordshire shows that the UK is still an attractive market.

However, two main headwinds threaten to halt the growth. A skills shortage created by a weak pipeline for trained contractors is leading to increasing wage competition, pushing companies to look for new markets. Energy demand is rising faster than we are building new supply, placing pressure on energy grids. A focus on upskilling labour and improving the energy infrastructure across the UK can ensure that investment in the sector can flow into the UK.

Life sciences is one sector the government itself identifies as a “growth priority” and last year’s autumn statement provided £520 million of new funding to manufacturing in the sector. The UK industry has fostered significant advancements, such as the first Covid-19 vaccine, partly by leveraging the strength of the university sector. There have been calls for more spending in this area with some pointing out the global cost-benefit analysis for vaccine developments can be in the region of 20:1, the equivalent of spending £1 million and receiving £20 million worth of benefit. The UK has an opportunity to be a global leader in this sector but currently it only employs a relatively small proportion of the UK population, so directing more investment into it would require clear strategic foresight and planning for growth.

Fig. 1. Total GVA contribution to UK GDP by the manufacturing sector, 2022

The Department for Business and Trade’s 2023 UK

The pattern across these sectors is that currently there is a strong base that can be built upon to turn them into high growth areas. Our research into the manufacturing sector in the UK points to the wider benefits of investment in manufacturing beyond companies within the sector. While manufacturing firms contributed £184 billion to the UK economy in 2022, once their supply chains and employees’ spending are included that rises to half a trillion pounds (Fig 1).

Whether through more long-term policy planning, attracting investment, or increased infrastructure spending there are good opportunities for growth within manufacturing and industrial policy. The government should take note of the change of wind in industrial policy and direct investment to critical infrastructure to ensure the UK doesn’t muddle its way through to a period of stagnation. 

Fig. 1. Total GVA contribution to UK GDP by the manufacturing sector, 2022

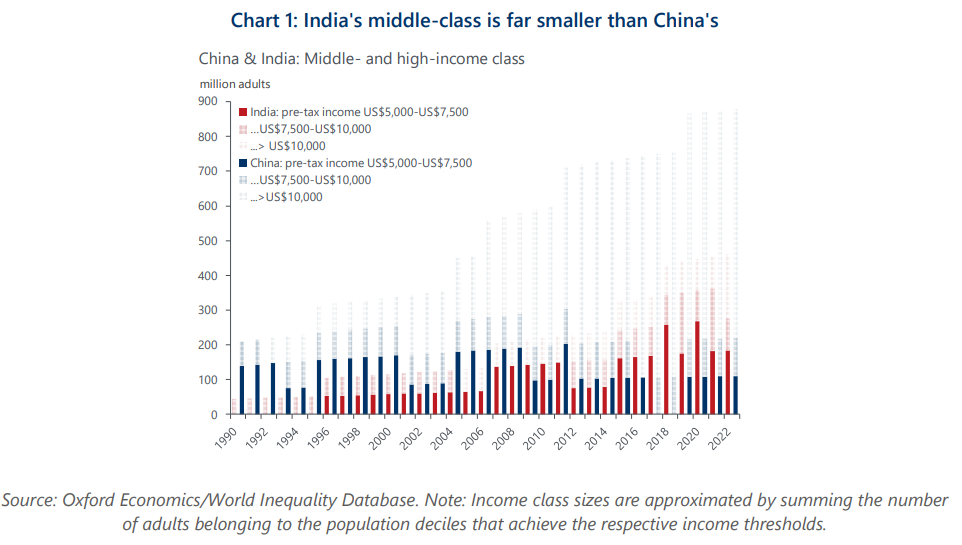
China-India – Expanding the middle classes

Indian consumers’ spending power is far behind that of their Chinese counterparts, and we are sceptical about the pace of catch-up. Even if the Indian economy achieves the ambitious growth targets set, there are few signs that record levels of income inequality will reverse soon.

What you will learn:

  • The income distribution within the middle class underscores the extent of the current divergence between China and India. India’s middle class remains heavily concentrated at the lower end of the income spectrum. However, our estimates suggest that efforts to reduce inequality could lift 100 million more Indians above the US$10,000 (upper middle-income class) threshold over the next decade.
  • The enormous potential of an expanding middle class with rising purchasing power can’t be overstated. It carries positive long-term ramifications for labour productivity and the economy’s overall growth resilience, and bodes well for companies looking for new vibrant markets.
  • Theoretically, unlocking this potential entails expanding the size of the overall economic pie – the ‘China way’ – and ensuring more equal distribution.
  • In China’s case, it’s less the inability, but more a seeming unwillingness to spend that is holding back consumers. In India, progress on various reforms to create employment outside of agriculture is crucial to raise incomes broadly and unlock the population’s spending power.

China-India – Expanding the middle classes

Indian consumers’ spending power is far behind that of their Chinese counterparts, and we are sceptical about the pace of catch-up. Even if the Indian economy achieves the ambitious growth targets set, there are few signs that record levels of income inequality will reverse soon.

Can we expect rate cuts in 2024?

Despite current speculations and recent inflation showing a modest re-acceleration, as well as growth in the economy remaining resilient despite higher interest rates, we don’t think it likely that the Fed will refrain from cutting rates until next year.

Global supply chains continue to normalise and remain consistent with ongoing goods price disinflation, at least for the next few months. Commodity prices also seem to have settled at higher levels, implying falling inflation, and although consumer prices are concentrated in the service sector are rising, recent surges in productivity and declining wage growth point to lower services price inflation ahead.

Considering the expectation of returning to 2% inflation, three reasons support the potential for the Fed to cut rates. Firstly, the time for monetary policy to impact the real economy has lengthened, necessitating prompt easing to prevent further economic slowdown and potential undershooting of the inflation target. Secondly, even if the Fed reduces rates by 75 basis points this year, monetary policy would remain restrictive, above levels considered neutral. Thirdly, the substantial reduction in fiscal policy stimulus compared to the previous year is anticipated in 2024, potentially facilitating the Fed’s control over inflation.

Can AI lift the long-term outlook?

The US is likely to be at the forefront of adoption of Generative AI, and it will drive a wedge between real estate returns and economic growth. The economic gains will come slowly over the next decade, and it could significantly raise the outlook for US GDP, but this will be driven by productivity rather than employment.

This growth will be accompanied by a reduction in demand for some types of space ¬– most notably office, but also life sciences and manufacturing as these areas have the highest exposure to generative AI.

Is globalisation over?

Although geopolitics may seem somewhat academic in the highly localised world of real estate, the magnitude of changes to domestic and international politics make it a factor shaping the outlook for real estate markets.

US and China decoupling is shaping domestic policies. Regardless of the outcome, the upcoming presidential election is likely to shape US domestic policies (through subsidies or tariffs) to see increased demand for industrial space as it seeks to replace parts of the global supply chain, with foreign investment into US real estate set to remain weak.

Is it a new era for inflation and rates?

A persistently higher inflation regime would have profound impacts on real estate returns as well as other asset classes and the relationships between them. Currently financial markets are pricing in approximately a 30% chance that inflation will still be 3% or above in 5 years’ time but we think those odds are too high because a high proportion of the recent surge in inflation can be explained by excess demand.

But we are more cautious when it comes to the volatility of inflation. The pre-pandemic economy was unusual for its low and stable inflation rate, with the 20 years leading up to the pandemic being the lowest and most stable periods of inflation over the past 700 years. Whilst the simple law of averages would suggest the future is set to be more volatile, geopolitics and the disruptive influence of generative AI also point in that direction. And if we do see more volatility, we expect central banks to react more swiftly to nascent signs of inflation in the future.

The recent collapse of the Baltimore Key Bridge is another reminder of how adverse supply shocks can also become more frequent as narrowing global supply chains place more emphasis on key assets.

The key lesson for real estate markets is that interest rates may be more volatile in the future.

Navigating the US Economic and Real Estate Transition

This year is set to be a turning point for commercial property markets in the US. A gradual easing in inflationary pressures alongside a steady, if unspectacular, year for GDP and employment growth should help to ease the market through the final leg of the post-COVID adjustment.

During my recent keynote presentation at the NCREIF 2024 Spring Conference in Phoenix, Arizona I shared four important themes market participants will need to understand to navigate the short and medium term successfully.

In this blog I shall delve into these four areas which are likely to have a bearing on returns, funding markets and the differing demand by property types.

Fundamentals favour London as a resi opportunity

Among major European cities, we think London offers the best outlook for residential real estate based on demographic trends and supply constraints. Amsterdam and Madrid are also promising. Prospects for cities in France, Germany, and Italy are more mixed, with stretched affordability supporting rental demand, whereas demographic dynamics are relatively weak.

What you will learn:

  • We forecast household numbers in Stockholm, Amsterdam and London will rise the most by the early 2030s. London also has a particularly high share of the population in the 20-34 age group, a key metric for rental demand.
  • We also project Milan’s younger population will increase healthily over the next decade or so. Alongside Milan’s particularly expensive property prices relative to incomes, and supply constraints, this should support growth in rental demand.
  • Berlin and Munich are both forecast to see weak growth in household formation and an outright fall in their 20-34-year-old populations. But in mitigation, the outlook for household income growth in the two German cities is comparatively strong.

Over All Market insight Real Estate today

A short introduction to your news and insight into adaptation to real estate global navigation 

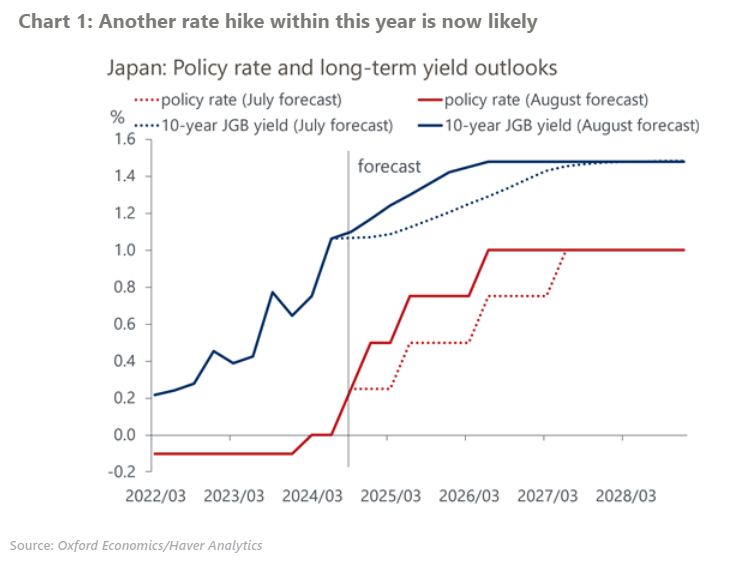
Japan’s BoJ is now likely to front-load policy normalisation

We now expect the Bank of Japan will implement an additional rate hike this year, possibly in October, given the hawkish forward guidance at the July meeting. We previously projected the central bank would wait until next spring to hike again. Thereafter, we expect the BoJ to become more cautious and raise rates only once per year in 2025 and 2026 to reach a terminal rate of 1%. What you will learn: The BoJ’s July policy statement said that the central bank will continue to normalise its policy rate as long as the economy stays on track with their projections. The BoJ emphasised that real interest rates are still significantly low and the policy rate will not likely reach the estimated range of a neutral rate anytime soon. We project the front-loaded rate hikes will have a manageable impact and not derail the economy from the wage-driven inflation process. A high proportion of households with net savings due to the aging society, together with the correction of yen weakness, will limit the damage to consumption. Decades of deleveraging has lowered the sensitivity of capex to a rate rise. The policy outlook faces high uncertainty. Financial market instability in early August invited criticism that the BoJ was too hasty to hike. Although a large chunk of yen carry trades appears to have been unwound for now, the BoJ may hesitate to hike rates if market instability relapses. Politics could become less supportive of rate hikes depending on who will succeed Prime Minister Fumio Kishida in September. While the unpopular yen weakness has receded for now, politicians may worry more about possible stock price correction and the rising damage to vulnerable but politically important agents, including hand-to-mouth households and micro enterprises.

Updating our Harris and Trump scenarios

Vice President Kamala Harris has released the first part of her economic plan. In it, she proposes an expansion of tax credits, lower prescription drug costs, and affordable housing initiatives. We consider this first tranche of her fiscal agenda in isolation and estimate that these policies would boost the level of real GDP by as much as 0.8% in the medium term. Stronger growth is accompanied by inflation, which is 0.2ppts higher relative to the baseline. What you will learn: While this is only one part of her economic plan, we have a better sense of what a broader tax and spending agenda would look like under a Harris presidency and a Democratic Congress. We revamped our scenario of full Democratic government control, which assumes Harris signs into law expansions to federal social benefits and higher taxes on corporations and high earners. On net, these policies lead to faster growth and inflation over the medium term. Longer term, inflation is modestly lower relative to the baseline, but the economy ends up larger thanks to the positive supply-side responses from the collection of family-support policies. We also updated our scenarios around a second presidency of Donald Trump. Most notably, we no longer expect a full repeal of the Inflation Reduction Act’s clean energy tax credits.

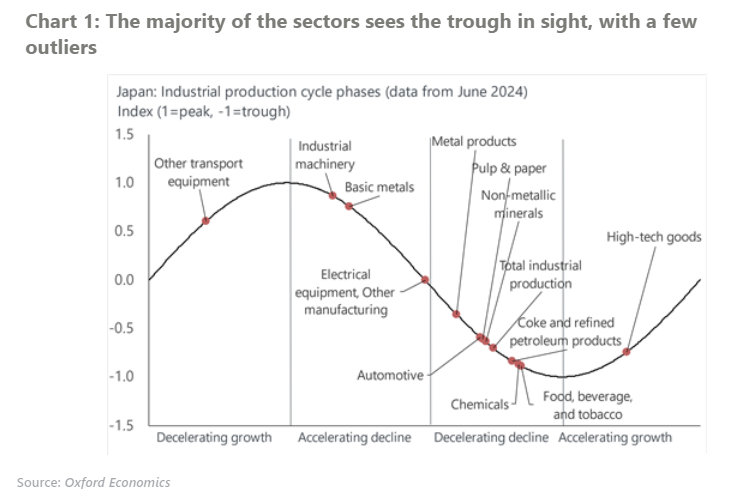
Japan’s industry nearing the trough, with high tech leading the way

Our new proprietary business cycle phase indicator points to a trough in sight for industry, but with dispersion among sectors. High tech is leading the pack with output firmly on its way up. While most other sectors have yet to reach a cyclical trough, we believe they are now closing in. What you will learn: Output of high-tech goods has been growing since the beginning of 2024 largely thanks to higher semiconductor production, notably bucking the downward trend across much of industry. We see momentum only strengthening from here, and at 4.1% growth for 2024, the industry is forecast to be one of the fastest-growing manufacturing sectors this year. Industrial machinery is on the other side of the spectrum, as it appears the slowdown since the end of 2022 is set to intensify. The softness is apparent across the board but is more pronounced in subsectors such as metal forming machinery, where a long inventory adjustment process appears inevitable. The auto sector’s position in the phase indicator is heavily distorted by the recurrent production stoppages stemming from the safety testing scandal. Absent these distortions, the sector would most likely be in the decelerating growth or accelerating decline phase. Chemicals have been declining since early 2022 due to higher energy prices but the turning point is close. The gradual appreciation of the yen will lower energy costs and support profit margins, although tighter monetary policy and the destocking cycle will keep growth in check.

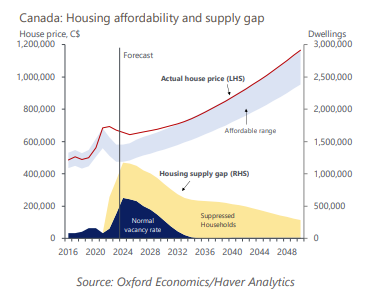
Canadian housing market will take another decade to rebalance

We believe that building enough homes to restore housing affordability across Canada will likely take another decade. To balance the housing market, we estimate 4.2mn new dwellings need to be built between 2024-2035, including 2.9mn to satisfy growth in households and 1.3mn to make up for past supply shortfalls, ensure a normal vacancy rate, and to remedy suppressed household formation due to unaffordability. What you will learn: While it will take a long time to construct the new dwellings Canada needs, we expect growth in the housing supply will be stronger than housing demand in the coming decade. This means house prices will rise more slowly than median household incomes. Housing affordability should progressively improve, with home ownership back within reach for typical households by 2035. Our analysis finds that the Canada Mortgage and Housing Corporation’s (CMHC) aspirational target to build 3.5mn houses by 2030, on top of those required for household formation, is not feasible and significantly overstates the actual number of new dwellings needed to restore affordability. Moreover, we have key concerns regarding such a massive potential addition to Canada’s housing supply. It would result in about 1 in 5 dwellings being unoccupied, raising the risk of an over-supplied housing market and a prolonged house price slump, especially as aging baby boomers begin selling or bestowing their homes in the mid-to-late 2030s.

Global Private equity real estate fund maturities spur asset sales

The private equity real estate industry has expanded significantly, achieving a global invested assets under management of $1.2tn. This showcases substantial growth from a decade ago. The growth in AUM will also lead to a large pipeline of fund maturities over the next few years. What you will learn: We expect the significant increases in fund maturities, spurred by capital raised over the past decade, to exert upward pressure on the rate of asset disposals as the funds approach the end of their lifecycles. Illiquidity in the market and a lack of price discovery have also caused a dearth of asset sales from PERE funds over the past two years. We now see a backlog of at least $200bn in assets that are in extension periods and will need to be sold down over the coming few years. Heightened trading activity from PERE funds will likely impact the CRE markets in numerous ways. This will allow investors seeking to deploy capital to specific markets and strategies to source product from these funds, and pricing may also be affected if heightened selling pressure is not offset by additional growth in the PERE industry.

Four themes are shaping US real estate markets

This year is set to be a turning point for commercial property markets in the US. A gradual easing of inflationary pressures alongside a steady, if unspectacular, year for GDP and employment growth should help to ease the market through the final leg of the post-Covid adjustment. But there are four important themes market participants will need to understand to navigate the short and medium term successfully. What you will learn: Rate cuts will come this year but only gradually. We believe the Federal Reserve will cut rates this year, and so looser monetary policy will help the refinancing of existing real estate deals heading into next year. Generative AI will drive a wedge between real estate returns and economic growth. We think generative AI has the potential to significantly raise the outlook for US GDP growth (more so than in other countries), but that will be accompanied by a reduction in demand for some types of space – most notably offices. The shifting geopolitical landscape has implications for the source of financing and the type of space in demand. We continue to think that the US will decouple from China either via industrial policy or the use of tariffs. Either way, foreign investment into US real estate is set to remain weak, and there should be an ongoing tailwind to the industrial sector as it seeks to replace parts of the global supply chain. It is unlikely persistently high inflation will continue in the medium term, but interest rates are likely to be more volatile. The pandemic has shown that second-round effects after price shocks are a reality, and so we expect central banks to react more swiftly to nascent signs of inflation in the future.

Australian office sustainability outcomes underpin asset performance

As more businesses commit to carbon net zero, those who occupy office space are increasingly seeking out more environmentally friendly buildings. The focus on green office buildings and sustainability is being driven by both government targets to achieve net zero and increasing corporate and investor focus on environmental, social, and corporate governance (ESG) considerations and compliance. What you will learn: NABERS data shows the proportion of rated office buildings across Australia with highly ranked sustainability credentials (achieving a 4 star+ NABERS energy efficiency rating) increased markedly from 67% in FY18 to 82% in FY23. There are premiums linked to buildings that are energy efficient and have higher NABERS and Green Star ratings. This is demonstrated by the current flight to quality and reflected in higher net absorption and stronger rental growth for prime buildings compared with secondary assets. We believe these trends will continue as businesses remain proactive in the management of ESG risks and opportunities, particularly around energy use, the changing regulatory environment and climate change.

Infographic: Key macroeconomic risks impacting global real estate performance

Continued economic growth will help stabilise commercial real estate yields and values before pricing slowly begins to recover next year. We expect global all-property total returns to average 5.3% per year over 2024-2025 in our baseline scenario. However, there are still upside and downside risks that real estate professionals should watch out for. In this infographic, we outline these risks and their impacts on property value. What you will learn: The most significant risk to property returns remains a scenario in which higher interest rates trigger sharp falls in stock markets and house prices, significantly tighter credit conditions, and several years of subpar growth. Escalation in Israel-Hamas war remains to be a downside risk. Over the next two years, the Asia-Pacific region would record the most severe drop in values, followed by the US. Office would likely record the largest drop on average. Geopolitical tensions are front and center in our increased China-Taiwan tensions scenario. We assume a decoupling of trade and technology starting in Q3 2024 through an increase in trade barriers against China and a shutdown of the transfer of knowledge.

World Bank Data Information

We’re update latest news to you , By the all information came from top global institution of World Bank 

GDP (current US$) World Development Indicators GDP at purchaser's prices ... World Bank national accounts data, and OECD National Accounts data files. Climate Change Economy & Growth
BR Brazil Latin America & Caribbean Latin America & Caribbean (excluding high income) Upper middle income IBRD Brasilia -47.9292 -15.7801
TH Thailand East Asia & Pacific East Asia & Pacific (excluding high income) Upper middle income IBRD Bangkok 100.521 13.7308
Agriculture & Rural Development For the 70 percent of the world's poor who live in rural areas, agriculture is the main source of income and employment. But depletion and degradation of land and water pose serious challenges to producing enough food and other agricultural products to sustain livelihoods here and meet the needs of urban populations. Data presented here include measures of agricultural inputs, outputs, and productivity compiled by the UN's Food and Agriculture Organization.
Aid Effectiveness Aid effectiveness is the impact that aid has in reducing poverty and inequality, increasing growth, building capacity, and accelerating achievement of the Millennium Development Goals set by the international community. Indicators here cover aid received as well as progress in reducing poverty and improving education, health, and other measures of human welfare.
Economy & Growth Economic growth is central to economic development. When national income grows, real people benefit. While there is no known formula for stimulating economic growth, data can help policy-makers better understand their countries' economic situations and guide any work toward improvement. Data here covers measures of economic growth, such as gross domestic product (GDP) and gross national income (GNI). It also includes indicators representing factors known to be relevant to economic growth, such as capital stock, employment, investment, savings, consumption, government spending, imports, and exports.
B8 Central Europe and the Baltics Aggregates Aggregates Aggregates
Education Education is one of the most powerful instruments for reducing poverty and inequality and lays a foundation for sustained economic growth. The World Bank compiles data on education inputs, participation, efficiency, and outcomes. Data on education are compiled by the United Nations Educational, Scientific, and Cultural Organization (UNESCO) Institute for Statistics from official responses to surveys and from reports provided by education authorities in each country.
Energy & Mining The world economy needs ever-increasing amounts of energy to sustain economic growth, raise living standards, and reduce poverty. But today's trends in energy use are not sustainable. As the world's population grows and economies become more industrialized, nonrenewable energy sources will become scarcer and more costly. Data here on energy production, use, dependency, and efficiency are compiled by the World Bank from the International Energy Agency and the Carbon Dioxide Information Analysis Center.
Environment Natural and man-made environmental resources – fresh water, clean air, forests, grasslands, marine resources, and agro-ecosystems – provide sustenance and a foundation for social and economic development. The need to safeguard these resources crosses all borders. Today, the World Bank is one of the key promoters and financiers of environmental upgrading in the developing world. Data here cover forests, biodiversity, emissions, and pollution. Other indicators relevant to the environment are found under data pages for Agriculture & Rural Development, Energy & Mining, Infrastructure, and Urban Development.
Financial Sector An economy's financial markets are critical to its overall development. Banking systems and stock markets enhance growth, the main factor in poverty reduction. Strong financial systems provide reliable and accessible information that lowers transaction costs, which in turn bolsters resource allocation and economic growth. Indicators here include the size and liquidity of stock markets; the accessibility, stability, and efficiency of financial systems; and international migration and workers\ remittances, which affect growth and social welfare in both sending and receiving countries.
Health Improving health is central to the Millennium Development Goals, and the public sector is the main provider of health care in developing countries. To reduce inequities, many countries have emphasized primary health care, including immunization, sanitation, access to safe drinking water, and safe motherhood initiatives. Data here cover health systems, disease prevention, reproductive health, nutrition, and population dynamics. Data are from the United Nations Population Division, World Health Organization, United Nations Children's Fund, the Joint United Nations Programme on HIV/AIDS, and various other sources.
Infrastructure Infrastructure helps determine the success of manufacturing and agricultural activities. Investments in water, sanitation, energy, housing, and transport also improve lives and help reduce poverty. And new information and communication technologies promote growth, improve delivery of health and other services, expand the reach of education, and support social and cultural advances. Data here are compiled from such sources as the International Road Federation, Containerisation International, the International Civil Aviation Organization, the International Energy Association, and the International Telecommunications Union.
Social Protection & Labor The supply of labor available in an economy includes people who are employed, those who are unemployed but seeking work, and first-time job-seekers. Not everyone who works is included: unpaid workers, family workers, and students are often omitted, while some countries do not count members of the armed forces. Data on labor and employment are compiled by the International Labour Organization (ILO) from labor force surveys, censuses, establishment censuses and surveys, and administrative records such as employment exchange registers and unemployment insurance schemes.
Poverty For countries with an active poverty monitoring program, the World Bank—in collaboration with national institutions, other development agencies, and civil society—regularly conducts analytical work to assess the extent and causes of poverty and inequality, examine the impact of growth and public policy, and review household survey data and measurement methods. Data here includes poverty and inequality measures generated from analytical reports, from national poverty monitoring programs, and from the World Bank’s Development Research Group which has been producing internationally comparable and global poverty estimates and lines since 1990.
Private Sector Private markets drive economic growth, tapping initiative and investment to create productive jobs and raise incomes. Trade is also a driver of economic growth as it integrates developing countries into the world economy and generates benefits for their people. Data on the private sector and trade are from the World Bank Group's Private Participation in Infrastructure Project Database, Enterprise Surveys, and Doing Business Indicators, as well as from the International Monetary Fund's Balance of Payments database and International Financial Statistics, the UN Commission on Trade and Development, the World Trade Organization, and various other sources.
Public Sector Effective governments improve people's standard of living by ensuring access to essential services – health, education, water and sanitation, electricity, transport – and the opportunity to live and work in peace and security. Data here includes World Bank staff assessments of country performance in economic management, structural policies, policies for social inclusion and equity, and public sector management and institutions for the poorest countries. Also included are indicators on revenues and expenses from the International Monetary Fund's Government Finance Statistics, and on tax policies from various sources. te>
Science & Technology Technological innovation, often fueled by governments, drives industrial growth and helps raise living standards. Data here aims to shed light on countries technology base: research and development, scientific and technical journal articles, high-technology exports, royalty and license fees, and patents and trademarks. Sources include the UNESCO Institute for Statistics, the U.S. National Science Board, the UN Statistics Division, the International Monetary Fund, and the World Intellectual Property Organization.
Social Development Data here cover child labor, gender issues, refugees, and asylum seekers. Children in many countries work long hours, often combining studying with work for pay. The data on their paid work are from household surveys conducted by the International Labour Organization (ILO), the United Nations Children's Fund (UNICEF), the World Bank, and national statistical offices. Gender disparities are measured using a compilation of data on key topics such as education, health, labor force participation, and political participation. Data on refugees are from the United Nations High Commissioner for Refugees complemented by statistics on Palestinian refugees under the mandate of the United Nations Relief and Works Agency.
Urban Development Cities can be tremendously efficient. It is easier to provide water and sanitation to people living closer together, while access to health, education, and other social and cultural services is also much more readily available. However, as cities grow, the cost of meeting basic needs increases, as does the strain on the environment and natural resources. Data on urbanization, traffic and congestion, and air pollution are from the United Nations Population Division, World Health Organization, International Road Federation, World Resources Institute, and other sources.
Gender Gender equality is a core development objective in its own right. It is also smart development policy and sound business practice. It is integral to economic growth, business growth and good development outcomes. Gender equality can boost productivity, enhance prospects for the next generation, build resilience, and make institutions more representative and effective. In December 2015, the World Bank Group Board discussed our new Gender Equality Strategy 2016-2023, which aims to address persistent gaps and proposed a sharpened focus on more and better gender data. The Bank Group is continually scaling up commitments and expanding partnerships to fill significant gaps in gender data. The database hosts the latest sex-disaggregated data and gender statistics covering demography, education, health, access to economic opportunities, public life and decision-making, and agency.
Millenium development goals
Climate Change Climate change is expected to hit developing countries the hardest. Its effects—higher temperatures, changes in precipitation patterns, rising sea levels, and more frequent weather-related disasters—pose risks for agriculture, food, and water supplies. At stake are recent gains in the fight against poverty, hunger and disease, and the lives and livelihoods of billions of people in developing countries. Addressing climate change requires unprecedented global cooperation across borders. The World Bank Group is helping support developing countries and contributing to a global solution, while tailoring our approach to the differing needs of developing country partners. Data here cover climate systems, exposure to climate impacts, resilience, greenhouse gas emissions, and energy use. Other indicators relevant to climate change are found under other data pages, particularly Environment, Agriculture & Rural Development, Energy & Mining, Health, Infrastructure, Poverty, and Urban Development.
External Debt Debt statistics provide a detailed picture of debt stocks and flows of developing countries. Data presented as part of the Quarterly External Debt Statistics takes a closer look at the external debt of high-income countries and emerging markets to enable a more complete understanding of global financial flows. The Quarterly Public Sector Debt database provides further data on public sector valuation methods, debt instruments, and clearly defined tiers of debt for central, state and local government, as well as extra-budgetary agencies and funds. Data are gathered from national statistical organizations and central banks as well as by various major multilateral institutions and World Bank staff.
Trade Trade is a key means to fight poverty and achieve the Millennium Development Goals, specifically by improving developing country access to markets, and supporting a rules based, predictable trading system. In cooperation with other international development partners, the World Bank launched the Transparency in Trade Initiative to provide free and easy access to data on country-specific trade policies.
Energy & Mining The world economy needs ever-increasing amounts of energy to sustain economic growth, raise living standards, and reduce poverty. But today's trends in energy use are not sustainable. As the world's population grows and economies become more industrialized, nonrenewable energy sources will become scarcer and more costly. Data here on energy production, use, dependency, and efficiency are compiled by the World Bank from the International Energy Agency and the Carbon Dioxide Information Analysis Center.
Poverty For countries with an active poverty monitoring program, the World Bank—in collaboration with national institutions, other development agencies, and civil society—regularly conducts analytical work to assess the extent and causes of poverty and inequality, examine the impact of growth and public policy, and review household survey data and measurement methods. Data here includes poverty and inequality measures generated from analytical reports, from national poverty monitoring programs, and from the World Bank’s Development Research Group which has been producing internationally comparable and global poverty estimates and lines since 1990.
Energy intensity level of primary energy (MJ/$2017 PPP GDP) World Development Indicators Energy intensity level of primary energy is the ratio between energy supply and gross domestic product measured at purchasing power parity. Energy intensity is an indication of how much energy is used to produce one unit of economic output. Lower ratio indicates that less energy is used to produce one unit of output. IEA, IRENA, UNSD, World Bank, WHO. 2023. Tracking SDG 7: The Energy Progress Report. World Bank, Washington DC. © World Bank. License: Creative Commons Attribution—NonCommercial 3.0 IGO (CC BY-NC 3.0 IGO).
Energy & Mining Environment
Access to electricity, rural (% of rural population) World Development Indicators Access to electricity, rural is the percentage of rural population with access to electricity. IEA, IRENA, UNSD, World Bank, WHO. 2023. Tracking SDG 7: The Energy Progress Report. World Bank, Washington DC. © World Bank. License: Creative Commons Attribution—NonCommercial 3.0 IGO (CC BY-NC 3.0 IGO).
Agriculture & Rural Development Energy & Mining
Access to electricity, urban (% of urban population) World Development Indicators Access to electricity, urban is the percentage of urban population with access to electricity. IEA, IRENA, UNSD, World Bank, WHO. 2023. Tracking SDG 7: The Energy Progress Report. World Bank, Washington DC. © World Bank. License: Creative Commons Attribution—NonCommercial 3.0 IGO (CC BY-NC 3.0 IGO).
Energy & Mining Urban Development
Access to electricity (% of population) World Development Indicators Access to electricity is the percentage of population with access to electricity. Electrification data are collected from industry, national surveys and international sources. IEA, IRENA, UNSD, World Bank, WHO. 2023. Tracking SDG 7: The Energy Progress Report. World Bank, Washington DC. © World Bank. License: Creative Commons Attribution—NonCommercial 3.0 IGO (CC BY-NC 3.0 IGO).
Energy & Mining Climate Change Environment
Electricity production from coal sources (% of total) World Development Indicators Sources of electricity refer to the inputs used to generate electricity. Coal refers to all coal and brown coal, both primary (including hard coal and lignite-brown coal) and derived fuels (including patent fuel, coke oven coke, gas coke, coke oven gas, and blast furnace gas). Peat is also included in this category. IEA Statistics © OECD/IEA 2014 (https://www.iea.org/data-and-statistics), subject to https://www.iea.org/terms/
Energy & Mining Climate Change Infrastructure
Electricity production from oil, gas and coal sources (% of total) World Development Indicators Sources of electricity refer to the inputs used to generate electricity. Oil refers to crude oil and petroleum products. Gas refers to natural gas but excludes natural gas liquids. Coal refers to all coal and brown coal, both primary (including hard coal and lignite-brown coal) and derived fuels (including patent fuel, coke oven coke, gas coke, coke oven gas, and blast furnace gas). Peat is also included in this category. IEA Statistics © OECD/IEA 2014 (https://www.iea.org/data-and-statistics), subject to https://www.iea.org/terms/
Energy & Mining Environment
Electricity production from hydroelectric sources (% of total) World Development Indicators Sources of electricity refer to the inputs used to generate electricity. Hydropower refers to electricity produced by hydroelectric power plants. IEA Statistics © OECD/IEA 2014 (https://www.iea.org/data-and-statistics), subject to https://www.iea.org/terms/
Energy & Mining Climate Change Infrastructure
Electric power transmission and distribution losses (% of output) World Development Indicators Electric power transmission and distribution losses include losses in transmission between sources of supply and points of distribution and in the distribution to consumers, including pilferage. IEA Statistics © OECD/IEA 2018 (https://www.iea.org/data-and-statistics), subject to https://www.iea.org/terms/
Energy & Mining Infrastructure
Electricity production from natural gas sources (% of total) World Development Indicators Sources of electricity refer to the inputs used to generate electricity. Gas refers to natural gas but excludes natural gas liquids. IEA Statistics © OECD/IEA 2014 (https://www.iea.org/data-and-statistics), subject to https://www.iea.org/terms/
Energy & Mining Climate Change Infrastructure
Electricity production from nuclear sources (% of total) World Development Indicators Sources of electricity refer to the inputs used to generate electricity. Nuclear power refers to electricity produced by nuclear power plants. IEA Statistics © OECD/IEA 2014 (https://www.iea.org/data-and-statistics), subject to https://www.iea.org/terms/
Energy & Mining Climate Change Infrastructure
Electricity production from oil sources (% of total) World Development Indicators Sources of electricity refer to the inputs used to generate electricity. Oil refers to crude oil and petroleum products. IEA Statistics © OECD/IEA 2014 (https://www.iea.org/data-and-statistics), subject to https://www.iea.org/terms/
Energy & Mining Climate Change Infrastructure
Renewable electricity output (% of total electricity output) World Development Indicators Renewable electricity is the share of electrity generated by renewable power plants in total electricity generated by all types of plants. IEA Statistics © OECD/IEA 2018 (https://www.iea.org/data-and-statistics), subject to https://www.iea.org/terms/
Energy & Mining Climate Change Environment
Electricity production from renewable sources, excluding hydroelectric (kWh) World Development Indicators Electricity production from renewable sources, excluding hydroelectric, includes geothermal, solar, tides, wind, biomass, and biofuels. IEA Statistics © OECD/IEA 2014 (https://www.iea.org/data-and-statistics), subject to https://www.iea.org/terms/
Energy & Mining Climate Change Environment
Electricity production from renewable sources, excluding hydroelectric (% of total) World Development Indicators Electricity production from renewable sources, excluding hydroelectric, includes geothermal, solar, tides, wind, biomass, and biofuels. IEA Statistics © OECD/IEA 2014 (https://www.iea.org/data-and-statistics), subject to https://www.iea.org/terms/
Energy & Mining Climate Change Environment
Renewable energy consumption (% of total final energy consumption) World Development Indicators Renewable energy consumption is the share of renewables energy in total final energy consumption. IEA, IRENA, UNSD, World Bank, WHO. 2023. Tracking SDG 7: The Energy Progress Report. World Bank, Washington DC. © World Bank. License: Creative Commons Attribution—NonCommercial 3.0 IGO (CC BY-NC 3.0 IGO).
Energy & Mining Climate Change Environment
GDP per unit of energy use (PPP $ per kg of oil equivalent) World Development Indicators GDP per unit of energy use is the PPP GDP per kilogram of oil equivalent of energy use. PPP GDP is gross domestic product converted to current international dollars using purchasing power parity rates based on the 2017 ICP round. An international dollar has the same purchasing power over GDP as a U.S. dollar has in the United States. IEA Statistics © OECD/IEA 2014 (https://www.iea.org/data-and-statistics), subject to https://www.iea.org/terms/
Energy & Mining
GDP per unit of energy use (constant 2017 PPP $ per kg of oil equivalent) World Development Indicators GDP per unit of energy use is the PPP GDP per kilogram of oil equivalent of energy use. PPP GDP is gross domestic product converted to 2017 constant international dollars using purchasing power parity rates. An international dollar has the same purchasing power over GDP as a U.S. dollar has in the United States. IEA Statistics © OECD/IEA 2014 (https://www.iea.org/data-and-statistics), subject to https://www.iea.org/terms/
Energy & Mining
Energy imports, net (% of energy use) World Development Indicators Net energy imports are estimated as energy use less production, both measured in oil equivalents. A negative value indicates that the country is a net exporter. Energy use refers to use of primary energy before transformation to other end-use fuels, which is equal to indigenous production plus imports and stock changes, minus exports and fuels supplied to ships and aircraft engaged in international transport. IEA Statistics © OECD/IEA 2014 (https://www.iea.org/data-and-statistics), subject to https://www.iea.org/terms/
Energy & Mining Trade
Access to non-solid fuel, rural (% of rural population) WDI Database Archives Access to non-solid fuel, rural is the percentage of rural population with access to non-solid fuel. World Bank, Sustainable Energy for All (SE4ALL) database from WHO Global Household Energy database.
Agriculture & Rural Development Energy & Mining
Access to non-solid fuel, urban (% of urban population) WDI Database Archives Access to non-solid fuel, urban is the percentage of urban population with access to non-solid fuel. World Bank, Sustainable Energy for All (SE4ALL) database from WHO Global Household Energy database.
Energy & Mining Urban Development
Access to non-solid fuel (% of population) WDI Database Archives Access to non-solid fuel is the percentage of population with access to non-solid fuel. World Bank, Sustainable Energy for All (SE4ALL) database from WHO Global Household Energy database.
Energy & Mining Environment
Alternative and nuclear energy (% of total energy use) World Development Indicators Clean energy is noncarbohydrate energy that does not produce carbon dioxide when generated. It includes hydropower and nuclear, geothermal, and solar power, among others. IEA Statistics © OECD/IEA 2014 (https://www.iea.org/data-and-statistics), subject to https://www.iea.org/terms/
Energy & Mining
Fossil fuel energy consumption (% of total) World Development Indicators Fossil fuel comprises coal, oil, petroleum, and natural gas products. IEA Statistics © OECD/IEA 2014 (https://www.iea.org/data-and-statistics), subject to https://www.iea.org/terms/
Energy & Mining
Energy use (kg of oil equivalent) per $1,000 GDP (constant 2017 PPP) World Development Indicators Energy use per PPP GDP is the kilogram of oil equivalent of energy use per constant PPP GDP. Energy use refers to use of primary energy before transformation to other end-use fuels, which is equal to indigenous production plus imports and stock changes, minus exports and fuels supplied to ships and aircraft engaged in international transport. PPP GDP is gross domestic product converted to 2017 constant international dollars using purchasing power parity rates. An international dollar has the same purchasing power over GDP as a U.S. dollar has in the United States. IEA Statistics © OECD/IEA 2014 (https://www.iea.org/data-and-statistics), subject to https://www.iea.org/terms/
Energy & Mining Climate Change
Combustible renewables and waste (% of total energy) World Development Indicators Combustible renewables and waste comprise solid biomass, liquid biomass, biogas, industrial waste, and municipal waste, measured as a percentage of total energy use. IEA Statistics © OECD/IEA 2014 (https://www.iea.org/data-and-statistics), subject to https://www.iea.org/terms/
Energy & Mining
Electric power consumption (kWh per capita) World Development Indicators Electric power consumption measures the production of power plants and combined heat and power plants less transmission, distribution, and transformation losses and own use by heat and power plants. IEA Statistics © OECD/IEA 2014 (https://www.iea.org/data-and-statistics), subject to https://www.iea.org/terms/
Energy & Mining Climate Change Infrastructure
Energy use (kg of oil equivalent per capita) World Development Indicators Energy use refers to use of primary energy before transformation to other end-use fuels, which is equal to indigenous production plus imports and stock changes, minus exports and fuels supplied to ships and aircraft engaged in international transport. IEA Statistics © OECD/IEA 2014 (https://www.iea.org/data-and-statistics), subject to https://www.iea.org/terms/
Energy & Mining Climate Change
CO2 emissions from gaseous fuel consumption (% of total) World Development Indicators Carbon dioxide emissions from liquid fuel consumption refer mainly to emissions from use of natural gas as an energy source. Carbon Dioxide Information Analysis Center, Environmental Sciences Division, Oak Ridge National Laboratory, Tennessee, United States.
Energy & Mining Climate Change Environment
CO2 emissions from liquid fuel consumption (kt) World Development Indicators Carbon dioxide emissions from liquid fuel consumption refer mainly to emissions from use of petroleum-derived fuels as an energy source. Carbon Dioxide Information Analysis Center, Environmental Sciences Division, Oak Ridge National Laboratory, Tennessee, United States.
Energy & Mining Climate Change Environment
Methane emissions in energy sector (thousand metric tons of CO2 equivalent) World Development Indicators Methane emissions from energy processes are emissions from the production, handling, transmission, and combustion of fossil fuels and biofuels. Climate Watch Historical GHG Emissions (1990-2020). 2023. Washington, DC: World Resources Institute. Available online at: https://www.climatewatchdata.org/ghg-emissions
Energy & Mining Environment
Energy related methane emissions (% of total) World Development Indicators Methane emissions from energy processes are emissions from the production, handling, transmission, and combustion of fossil fuels and biofuels. World Bank staff estimates from original source: European Commission, Joint Research Centre (JRC)/Netherlands Environmental Assessment Agency (PBL). Emission Database for Global Atmospheric Research (EDGAR): http://edgar.jrc.ec.europa.eu/.
Energy & Mining Environment
Nitrous oxide emissions in energy sector (thousand metric tons of CO2 equivalent) World Development Indicators Nitrous oxide emissions from energy processes are emissions produced by the combustion of fossil fuels and biofuels. Climate Watch Historical GHG Emissions (1990-2020). 2023. Washington, DC: World Resources Institute. Available online at: https://www.climatewatchdata.org/ghg-emissions
Energy & Mining Environment
Nitrous oxide emissions in energy sector (% of total) World Development Indicators Nitrous oxide emissions from energy processes are emissions produced by the combustion of fossil fuels and biofuels. World Bank staff estimates from original source: European Commission, Joint Research Centre (JRC)/Netherlands Environmental Assessment Agency (PBL). Emission Database for Global Atmospheric Research (EDGAR): http://edgar.jrc.ec.europa.eu/.
Energy & Mining Environment
Pump price for diesel fuel (US$ per liter) World Development Indicators Fuel prices refer to the pump prices of the most widely sold grade of diesel fuel. Prices have been converted from the local currency to U.S. dollars. German Agency for International Cooperation (GIZ).
Energy & Mining Urban Development
Pump price for gasoline (US$ per liter) World Development Indicators Fuel prices refer to the pump prices of the most widely sold grade of gasoline. Prices have been converted from the local currency to U.S. dollars. German Agency for International Cooperation (GIZ).
Energy & Mining Urban Development
Time to obtain an electrical connection (days) World Development Indicators The average wait, in days, experienced to obtain an electrical connection from the day an establishment applies for it to the day it receives the service. World Bank, Enterprise Surveys (http://www.enterprisesurveys.org/).
Energy & Mining Private Sector
Time required to get electricity (days) World Development Indicators Time required to get electricity is the number of days to obtain a permanent electricity connection. The measure captures the median duration that the electricity utility and experts indicate is necessary in practice, rather than required by law, to complete a procedure. World Bank, Doing Business project (http://www.doingbusiness.org/). NOTE: Doing Business has been discontinued as of 9/16/2021. For more information: https://bit.ly/3CLCbme
Energy & Mining Private Sector
Firms using banks to finance investment (% of firms) World Development Indicators Firms using banks to finance investment are the percentage of firms using banks to finance investments. World Bank, Enterprise Surveys (http://www.enterprisesurveys.org/).
Energy & Mining Private Sector
Value lost due to electrical outages (% of sales for affected firms) World Development Indicators Average losses due to electrical outages, as percentage of total annual sales. The value represents average losses for all firms which reported outages (please see indicator IC.ELC.OUTG.ZS). World Bank, Enterprise Surveys (http://www.enterprisesurveys.org/).
Energy & Mining Private Sector
Investment in energy with private participation (current US$) World Development Indicators Investment in energy projects with private participation refers to commitments to infrastructure projects in energy (electricity and natural gas: generation, transmission and distribution) that have reached financial closure and directly or indirectly serve the public. Movable assets and small projects such as windmills are excluded. The types of projects included are management and lease contracts, operations and management contracts with major capital expenditure, greenfield projects (in which a private entity or a public-private joint venture builds and operates a new facility), and divestitures. Investment commitments are the sum of investments in facilities and investments in government assets. Investments in facilities are the resources the project company commits to invest during the contract period either in new facilities or in expansion and modernization of existing facilities. Investments in government assets are the resources the project company spends on acquiring government assets such as state-owned enterprises, rights to provide services in a specific area, or the use of specific radio spectrums. Data is presented based on investment year. Data are in current U.S. dollars. World Bank, Private Participation in Infrastructure Project Database (http://ppi.worldbank.org).
Energy & Mining Infrastructure Private Sector
Adjusted savings: mineral depletion (current US$) World Development Indicators Mineral depletion is the ratio of the value of the stock of mineral resources to the remaining reserve lifetime (capped at 25 years). It covers tin, gold, lead, zinc, iron, copper, nickel, silver, bauxite, and phosphate. World Bank staff estimates based on sources and methods in World Bank's "The Changing Wealth of Nations: Measuring Sustainable Development in the New Millennium" (2011).
Economy & Growth Energy & Mining Environment
Adjusted savings: mineral depletion (% of GNI) World Development Indicators Mineral depletion is the ratio of the value of the stock of mineral resources to the remaining reserve lifetime (capped at 25 years). It covers tin, gold, lead, zinc, iron, copper, nickel, silver, bauxite, and phosphate. World Bank staff estimates based on sources and methods in World Bank's "The Changing Wealth of Nations: Measuring Sustainable Development in the New Millennium" (2011).
Economy & Growth Energy & Mining Environment
Adjusted savings: energy depletion (current US$) World Development Indicators Energy depletion is the ratio of the value of the stock of energy resources to the remaining reserve lifetime (capped at 25 years). It covers coal, crude oil, and natural gas. World Bank staff estimates based on sources and methods in World Bank's "The Changing Wealth of Nations: Measuring Sustainable Development in the New Millennium" (2011).
Economy & Growth Energy & Mining Environment
Adjusted savings: energy depletion (% of GNI) World Development Indicators Energy depletion is the ratio of the value of the stock of energy resources to the remaining reserve lifetime (capped at 25 years). It covers coal, crude oil, and natural gas. World Bank staff estimates based on sources and methods in World Bank's "The Changing Wealth of Nations: Measuring Sustainable Development in the New Millennium" (2011).
Economy & Growth Energy & Mining Environment
Adjusted savings: natural resources depletion (% of GNI) World Development Indicators Natural resource depletion is the sum of net forest depletion, energy depletion, and mineral depletion. Net forest depletion is unit resource rents times the excess of roundwood harvest over natural growth. Energy depletion is the ratio of the value of the stock of energy resources to the remaining reserve lifetime (capped at 25 years). It covers coal, crude oil, and natural gas. Mineral depletion is the ratio of the value of the stock of mineral resources to the remaining reserve lifetime (capped at 25 years). It covers tin, gold, lead, zinc, iron, copper, nickel, silver, bauxite, and phosphate. World Bank staff estimates based on sources and methods in World Bank's "The Changing Wealth of Nations: Measuring Sustainable Development in the New Millennium" (2011).
Economy & Growth Energy & Mining
Mineral rents (% of GDP) World Development Indicators Mineral rents are the difference between the value of production for a stock of minerals at world prices and their total costs of production. Minerals included in the calculation are tin, gold, lead, zinc, iron, copper, nickel, silver, bauxite, and phosphate. World Bank staff estimates based on sources and methods described in the World Bank's The Changing Wealth of Nations.
Energy & Mining Environment
Natural gas rents (% of GDP) World Development Indicators Natural gas rents are the difference between the value of natural gas production at regional prices and total costs of production. World Bank staff estimates based on sources and methods described in the World Bank's The Changing Wealth of Nations.
Energy & Mining Environment
Oil rents (% of GDP) World Development Indicators Oil rents are the difference between the value of crude oil production at regional prices and total costs of production. World Bank staff estimates based on sources and methods described in the World Bank's The Changing Wealth of Nations.
Energy & Mining Environment
Total natural resources rents (% of GDP) World Development Indicators Total natural resources rents are the sum of oil rents, natural gas rents, coal rents (hard and soft), mineral rents, and forest rents. World Bank staff estimates based on sources and methods described in the World Bank's The Changing Wealth of Nations.
Energy & Mining Environment
Fuel imports (% of merchandise imports) World Development Indicators Fuels comprise the commodities in SITC section 3 (mineral fuels, lubricants and related materials). World Bank staff estimates through the WITS platform from the Comtrade database maintained by the United Nations Statistics Division.
Energy & Mining Private Sector Trade

Global Real Estate Insight


We’re update latest news to you , By the all information came from top global institution of oxford economic 

Compare listings

Compare